Create a Dashboard
When you open the Dashboard Designer, you can create a new dashboard from scratch or open an existing dashboard.
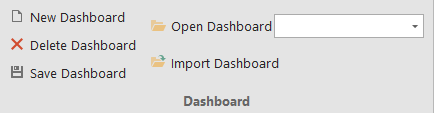
New Dashboard
1. Click on New Dashboard
2. The Data Source Browser will then be created. This browser allows you to navigate through the dashboard data source. It displays the data source structure and allows you to bind dashboard items to the required data source fields using drag-and-drop operations. The Data Source Browser also enables you to manage calculated fields.
Data Source Browser
The Data Source Browser contains the following elements.
-
Data Source drop-down list - allows you to select the required data source. The DataSource property identifies the currently selected data source.
-
Query/Data Member drop-down list - allows you to select the required query. The Field List property identifies the currently selected table in the database.

-
The following Command buttons are available.The
 button groups fields by type.The
 and
and  buttons are used to switch the sort order.The
 button reloads data from the data source.The
 button allows you to change the binding of the dashboard item to the currently selected data source.Field List displays data source fields. You can drag these fields to the data item placeholders to specify data binding.
 -
The Data Source Browser identifies the following data field types.Icon Description
 Boolean
 Byte
Byte Date-time
 Numeric
 String
 Calculated fieldData Items PaneThe DATA ITEMS pane is placed side-by-side with the Data Source Browser, and allows you to create and modify data binding using drag-and-drop operations.
 The DATA ITEMS pane can contain the following elements.
 -
Data Item placeholder - used to create data binding using drag-and-drop operations.
-
Data Item - identifies data binding by mapping to a particular data source field. Each data item has the Data Item menu button, used to invoke a menu that allows you to perform various data shaping operations.
-
Data Section - corresponds to a particular dashboard item area or element.
-
Data Item container - used to provide data item sets (e.g., for calculating the difference between two measures). Data item containers have Options buttons that allow you to change specific dashboard item settings (e.g., to switch between chart series types or grid column types).
-
Sort indicator - shows the current sort order for the data item.
-
Colouring indicator - indicates whether colouring by hue is enabled for the data item.Specific dashboard items have command buttons that allow you to perform various operations, for instance, to add a new pane to the chart dashboard item.