Dashboard Designer
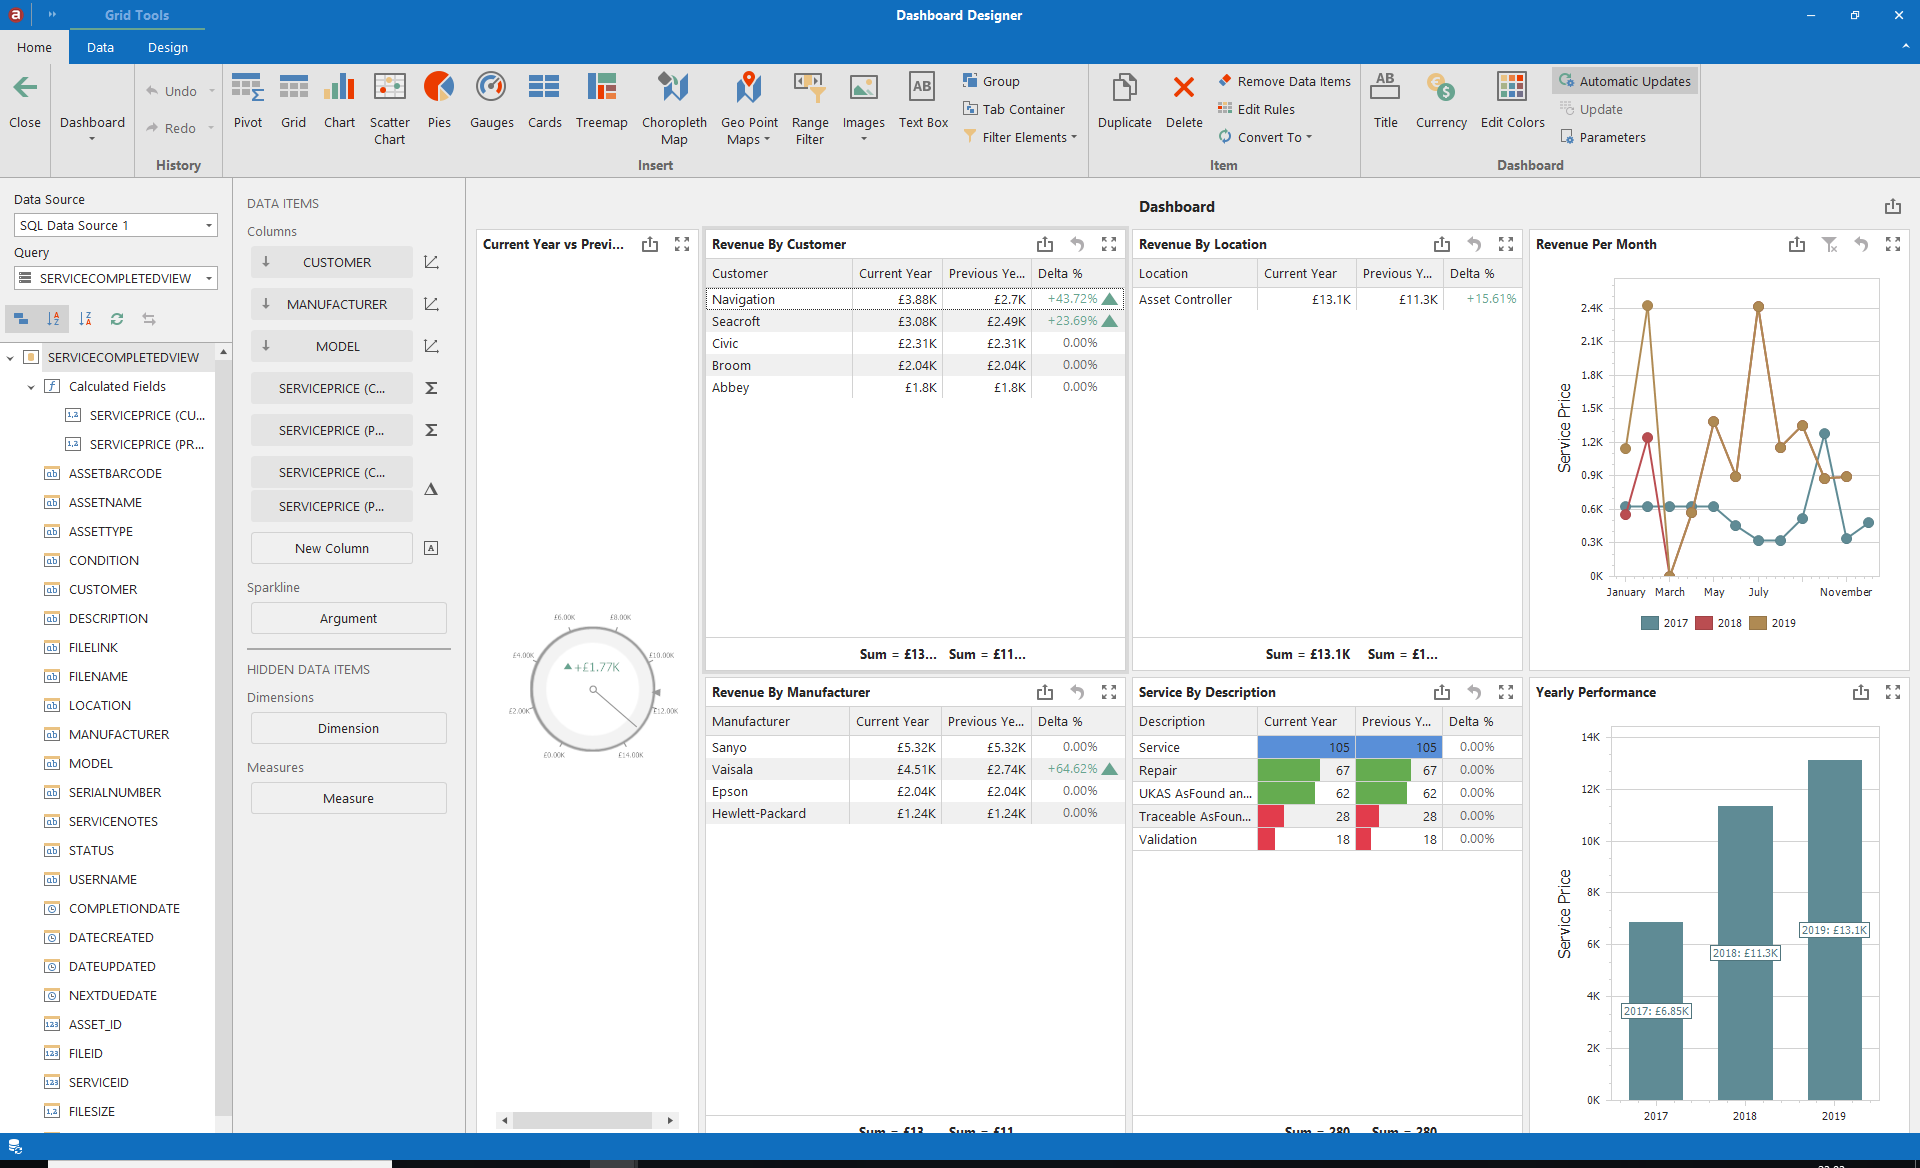
In this section, you will learn about the Dashboard. The dashboard visualises your data using different types of elements (dashboard items) - charts, grids and pivot tables, maps, etc. - and allows you to interact with these elements.
The Dashboard Designer is the primary tool for creating dashboards.
-
-
-
-
-
Data Shaping
-
Interactivity
-
Appearance Customization
-
Data Analysis
-
Converting Dashboard Items
-
Dashboard Layout
-
Undo and Redo Operations
-
Automatic and Manual Updates
-
Saving a Dashboard
-
Printing and Exporting
View Dashboard
1. Click on Main Screen -> Dashboard