Legend
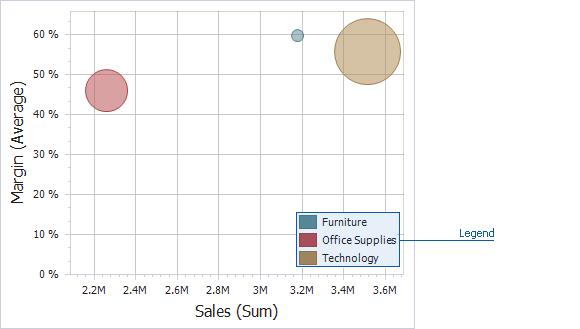
A legend is an element of a scatter chart that identifies chart points (for instance, coloured points corresponding to argument values).
This topic describes how to customize various legend settings.
Visibility
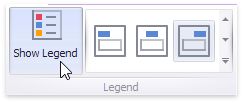
You can specify whether a chart should display a legend.
In the Designer, use the Show Legend button in the Legend group on the Design ribbon tab of the Scatter Chart Tools contextual tab set.
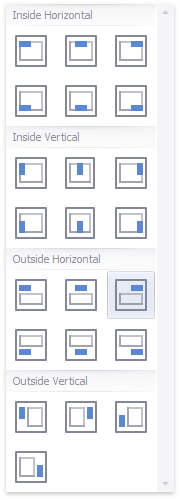
Position and Orientation
To specify the legend's position and orientation, select one of the predefined options from the gallery in the Legend group on the Design ribbon tab of the Scatter Chart Tools contextual tab set.