Providing Data
The image below shows a sample Chart dashboard item that is bound to data.
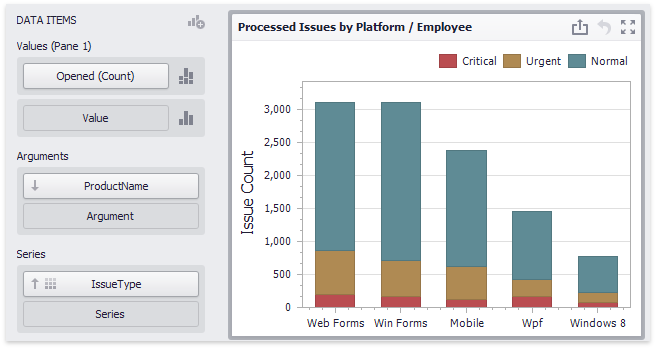
To bind the Chart dashboard item to data, drag and drop a data source field to a placeholder contained in one of the available data sections. The table below lists and describes the Chart's data sections.
|
Section
|
Processed as
|
Description
|
|
Values
|
Measure
|
Contains data items against which the Y-coordinates of data points are calculated. The Options button next to the Value data item allows you to select the series type and specify different options.
|
|
Arguments
|
Dimension
|
Contains data items that provide values displayed along the X-axis of the chart.
|
|
Series
|
Dimension
|
Contains data items whose values are used to create chart series.
|
Note that some types of series accept several measures. To learn more, see the documentation for the required series type.
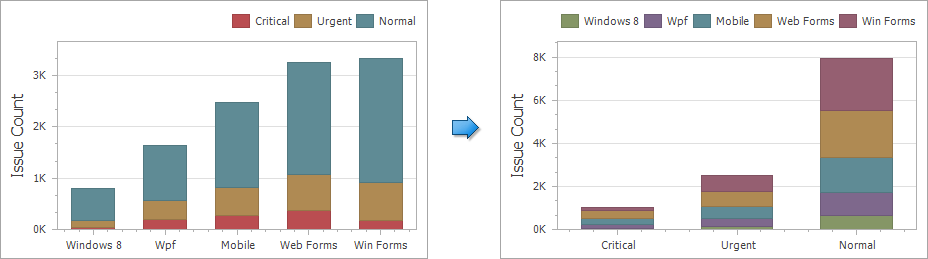
Transposing Arguments and Series
The Chart dashboard item provides the capability to transpose chart arguments and series. In this case, data items contained in the Arguments section are moved to the Series section, and vice versa.
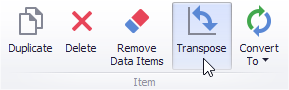
To transpose the selected Chart dashboard item, use the Transpose button in the Home ribbon tab.