Providing Data
The image below shows a sample Scatter Chart dashboard item that is bound to data.
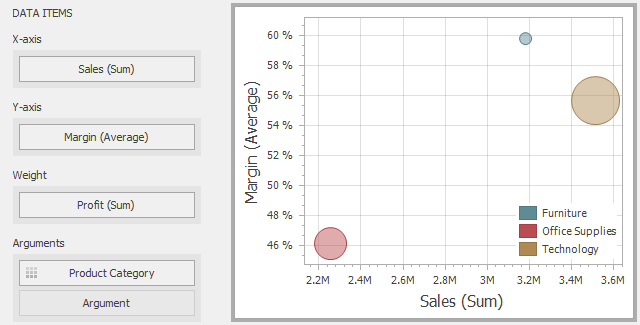
To bind the Scatter Chart dashboard item to data, drag and drop a data source field to a placeholder contained in one of the available data sections. A table below lists and describes Scatter Chart data sections.
|
Section
|
Processed as
|
Description
|
|
X-Axis
|
Measure
|
Contains the data item against which the X-coordinates of data points are calculated.
|
|
Y-Axis
|
Measure
|
Contains the data item against which the Y-coordinates of data points are calculated.
|
|
Weight
|
Measure
|
Contains the data item whose values are used to calculate the weight of data points.
|
|
Arguments
|
Dimension
|
Contains data items providing scatter chart arguments that are used to create data points.
|
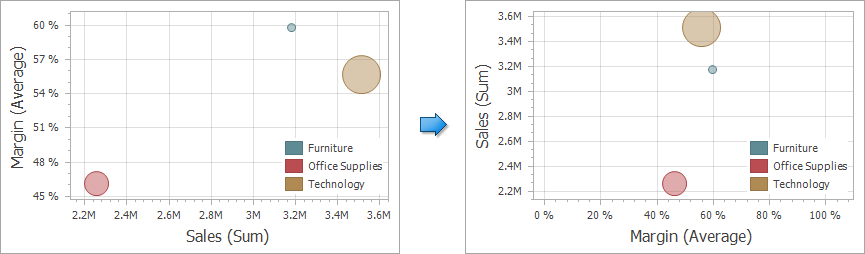
Transposing X- and Y-axis
The Scatter Chart dashboard item provides the capability to transpose its axes. In this case, the data item contained in the X-Axis section is moved to the Y-Axis section, and vice versa.
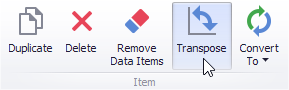
To transpose the selected Scatter Chart dashboard item, use the Transpose button in the Home ribbon tab.