
Series Overview
This section describes how to change the series type and specify various series options (for instance, how to use a secondary axis or enable point labels).
Series Types
To switch between series types in the Dashboard Designer, click the Options button next to the required data item (or placeholder) in the Values section.
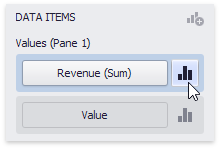
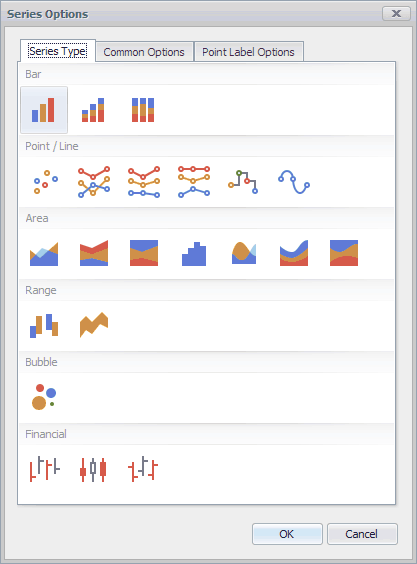
In the invoked Series Options dialog, select the required series type and click OK.
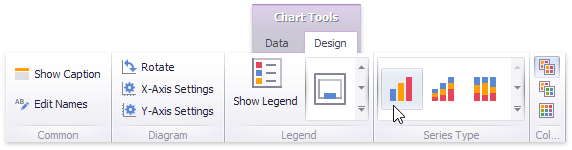
You can also do this using the Series Type gallery in the Design Ribbon tab.
Series Options
To manage common series options, use the Common Options tab of the Series Options dialog.
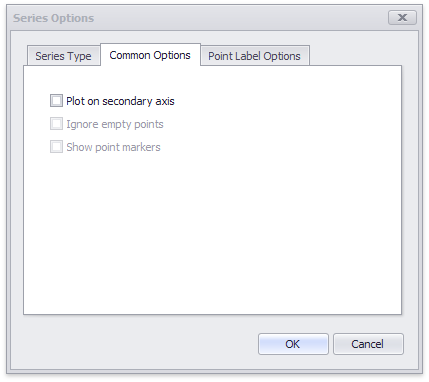
You can specify the following settings:
|
Option
|
Description
|
|
Plot on secondary axis
|
Specifies whether to use the secondary axis to plot the current series.
|
|
Ignore empty points
|
Specifies whether to ignore empty points when plotting the current series.
|
|
Show point markers
|
Specifies whether to show the current series's point markers.
This option is in effect for the following series:
Range: Range Area.
|
Series Point Labels
The Series Options dialog's Point Label Options tab allows you to enable series point labels and manage their settings.
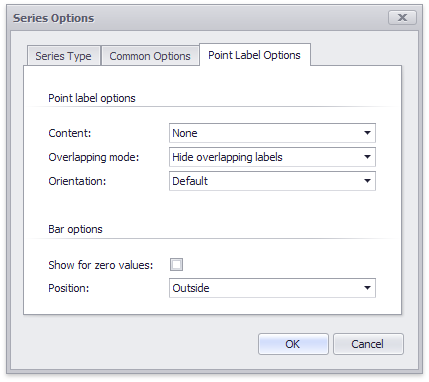
You can specify the following settings for point labels:
|
Option
|
Description
|
|
Content
|
Specifies the type of content displayed in point labels. You can select a single or several values from the drop-down list:
|
|
Overlapping mode
|
Specifies the label overlapping mode. The following options are available:
|
|
Orientation
|
Specifies point labels' orientation. The following options are available:
|
The following options are in effect for Bar series only:
|
Option
|
Description
|
|
Show for zero values
|
Specifies whether to display labels for points with zero values.
|
|
Position
|
Specifies point labels' position relative to bars.
|