
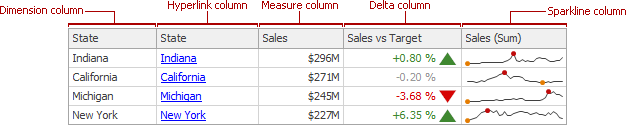
Sparkline Column
A sparkline column visualizes the variation of summary values over time.
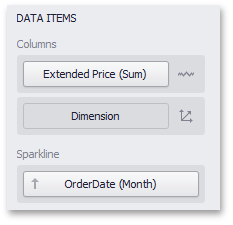
Data Binding Specifics
The sparkline column is bound to the measure providing sparkline values and to the dimension providing a date-time interval.
Sparkline Options
You can control sparkline appearance settings using the Column Options dialog. To invoke this dialog, click the column type indicator ( ).
).
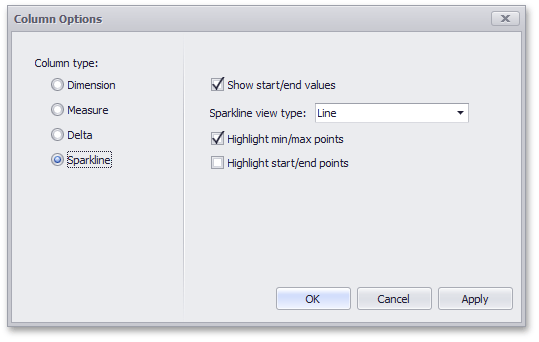
In this dialog, you can control various settings that affect how the sparkline is displayed within a grid cell.
|
Sparkline Options
|
Description
|
|
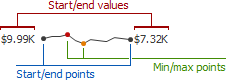
Show start/end values
|
Species whether to display sparkline start/end values within a grid cell.
|
|
Sparkline view type
|
Defines the view type of a sparkline. Sparkline data points can be represented as area, line, bars, or win and loss squares.
|
|
Highlight min/max points
|
Specifies whether to highlight the minimum/maximum points of a sparkline.
|
|
Highlight start/end points
|
Specifies whether to highlight the start/end points of a sparkline.
|