Y-Axis
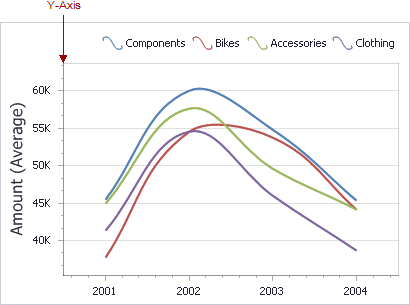
The Y-axis is the numerical axis of values.
To access Y-axis settings, use the Y-Axis Settings button in the Diagram section of the Design Ribbon tab of the Chart Tools contextual tab set.
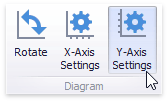
This will invoke the Y-Axis Settings dialog.
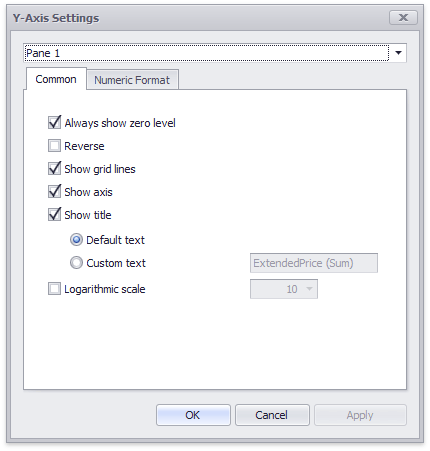
Use the combo box at the top to select the pane for the Y-axis settings you need to edit.
Common Settings
The Common tab contains the following settings.
|
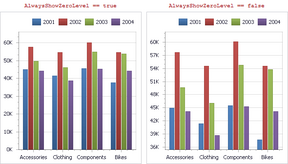
Always show zero level
|
Specifies whether the axis' zero level is visible. If this option is unchecked, the visible axis range is defined based on the values plotted in the chart.
 |
|
Reverse
|
Allows you to reverse the Y-axis. If the Y-axis is reversed, its values are ordered from top to down.
|
|
Show grid lines
|
Allows you to hide and show grid lines for the Y-axis.
|
|
Show Y-axis
|
Allows you to hide and show the Y-axis.
|
|
Show title
|
Allows you to hide and show the Y-axis title. You can choose whether to use the default text or specify a custom string.
|
|
Logarithmic scale
|
Specifies whether the axis should display its numerical values using a logarithmic scale. The combo box next to this option allows you to select the logarithmic base from one of the predefined values.
|
The Numeric Format tab allows you to specify the numeric display formats for Y-Axis data, as described in the Formatting Data document.
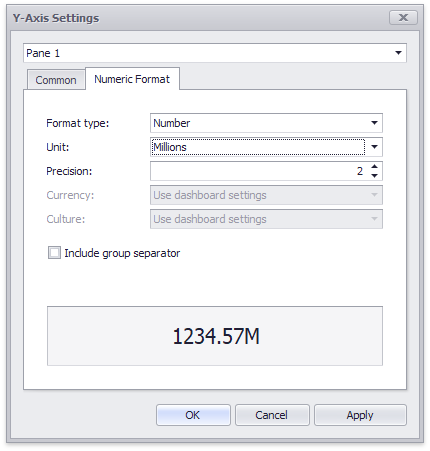
The tab contains the following settings.
|
Format type
|
Specifies format types for numeric values.
|
|
Unit
|
Specifies the unit to convert the numeric values.
|
|
Precision
|
Specifies the number of fractional digits to display.
|
|
Currency
|
Specifies the currency symbol and format
|
|
Culture
|
Specifies the name of a culture that defines the currency symbol and format.
|
|
Include group separator
|
Specifies whether separators should be inserted between digit groups.
|
Secondary Y-Axis
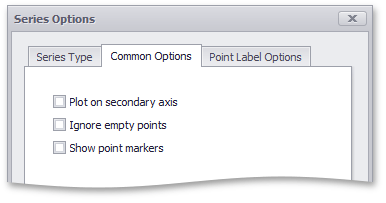
The secondary Y-axis is useful when it is necessary to visually combine several charts into one. Secondary axes provide the ability to plot series with different ranges on the same chart.
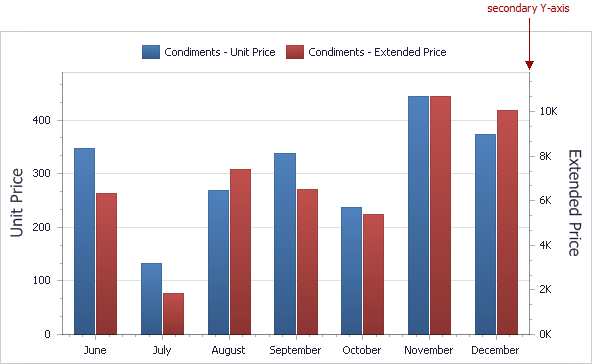
To plot the required series using the secondary axis, enable the Plot on secondary axis option in the Series Options dialog.