Colouring
Certain dashboard items provide the capability to colour dashboard item elements by associating dimension values/measures and specified colours. You can choose whether to use a global colour scheme to provide consistent colours for identical values or specify a local colour scheme for each dashboard item. To learn more about colouring concepts common for all dashboard items, see the Colouring section.
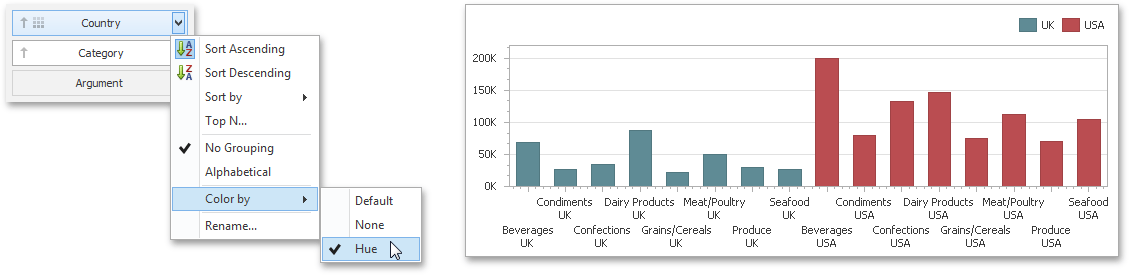
By default, the Chart dashboard item colours different measures and series dimensions by hue. In the example below, series points corresponding to different countries (UK and USA) are painted in different colours.