
Diagram
The Diagram can bring your team together to make better business decisions by allowing them to create new diagrams, modify existing diagrams, save diagrams to and load from XML, and export to multiple image formats (BMP, JPEG, PNG and GIF).
In this section, you will learn about the Diagram:
View Find and Fix
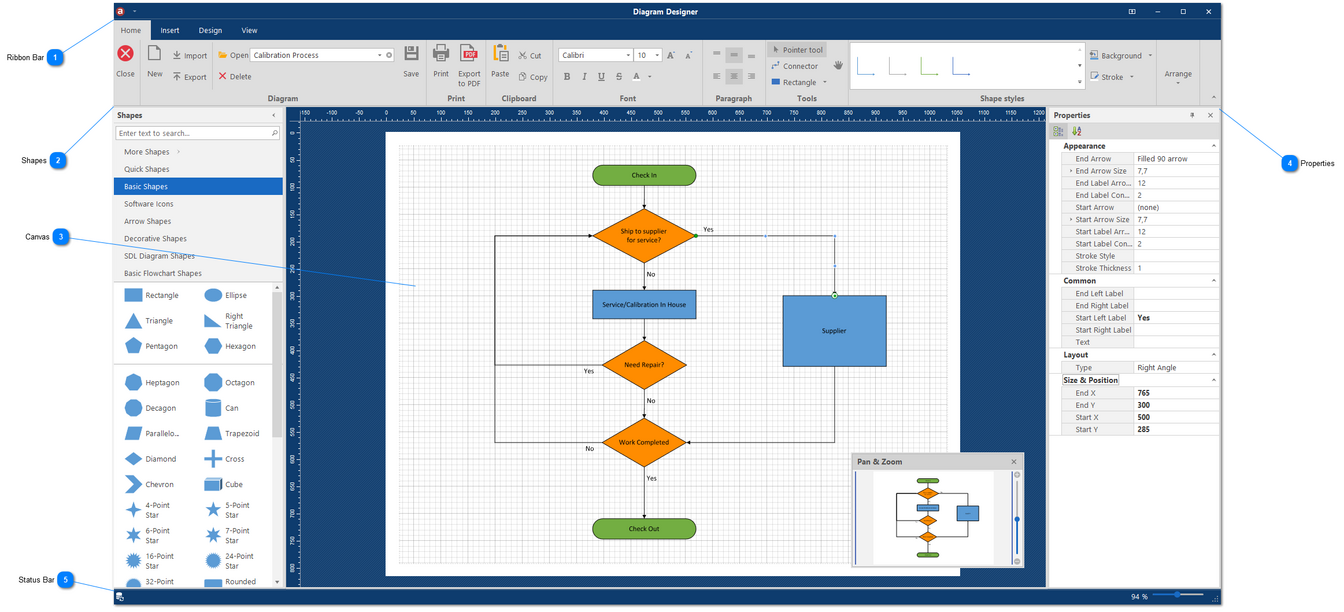

Shapes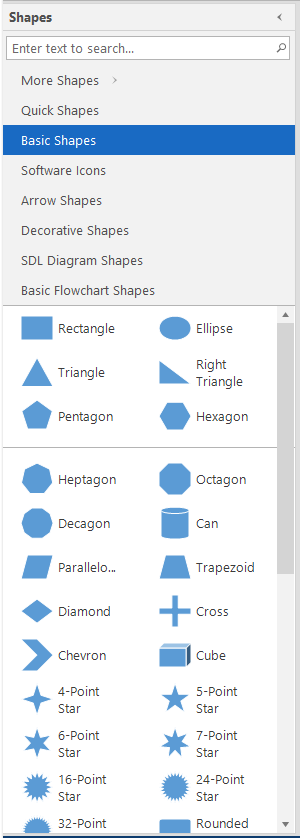 The Shapes panel displays available shapes that users can drag to the canvas.
Shapes are organized into categories. The search form that is displayed at the top of the panel allows you to search a shape by its name. The drop-down button
|
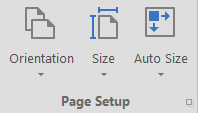
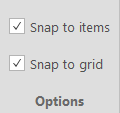
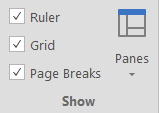
Canvas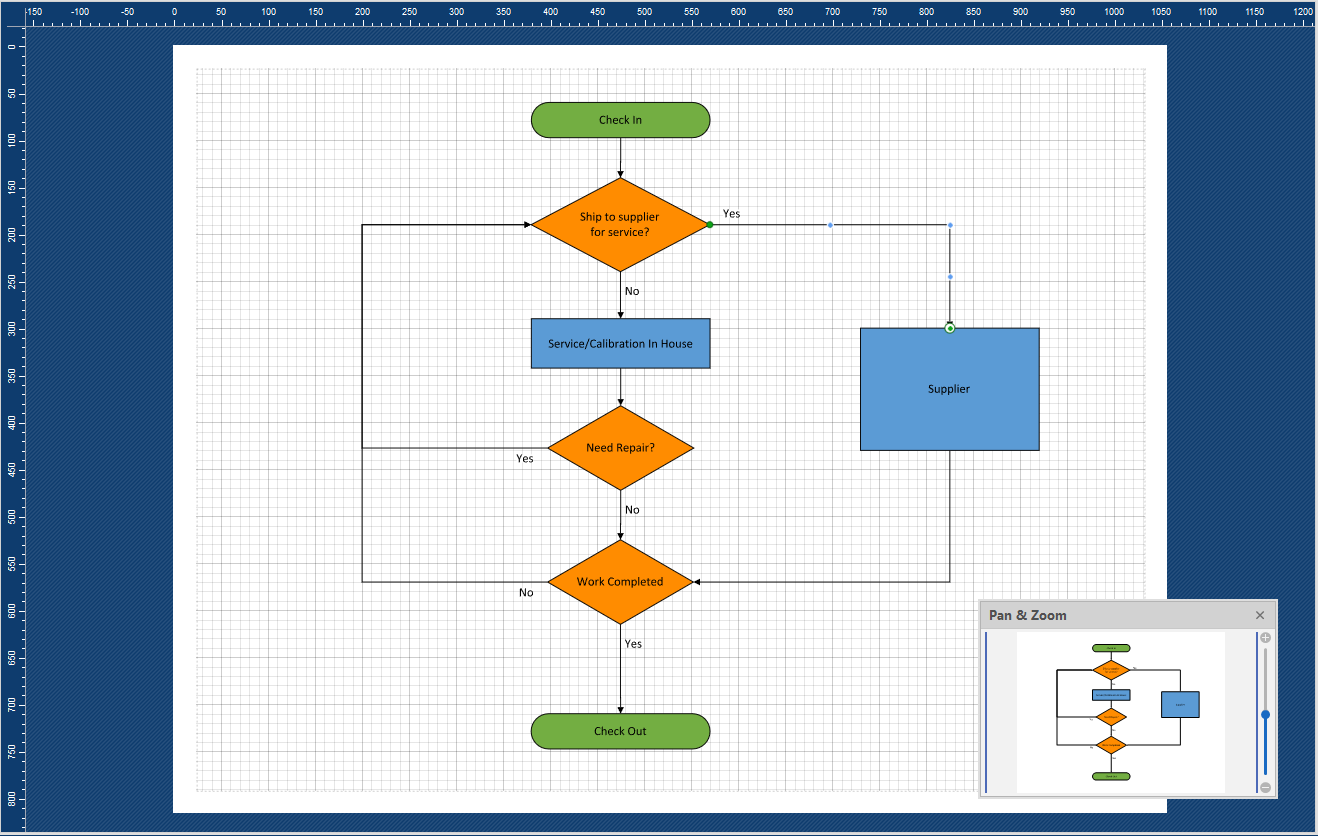 The Canvas is the working area where you build diagrams using shapes and connectors. It shows a grid and rulers that help you to arrange shapes. The grid and rulers can be hidden by toggling the corresponding options within the view page of the ribbon bar.
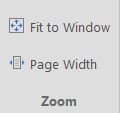
The grid is dynamically changed during zooming. When you zoom in or out of the drawing, the grid spacing is adjusted automatically to be more appropriate for the new magnification.
|
Properties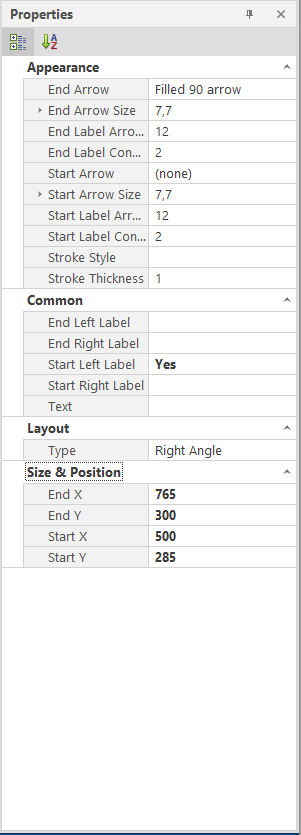 The Properties Panel provides property information about the selected object on the canvas.
You can can toggle the auto-hide mode or close the panel. To show the panel, right-click a diagram item or empty space in the canvas and select Properties in the menu. You can also use the ribbon bar UI (View > Panes) to show or hide the Properties panel.
|
To scroll the diagram contents
Select the pan tool in the Tools group of the ribbon bar and drag on the canvas or use the scrollbars.
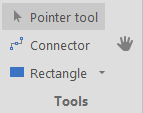
To add a shape to the canvas
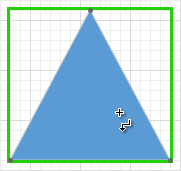
Drag the shape from the Shapes Panel or select a drawing tool (Rectangle, Ellipse, Right Triangle, Hexagon) in the Tools group of the ribbon bar and drag on the canvas to draw the corresponding shape.
To select shapes on the canvas
Select the Pointer tool in the Tools group of the ribbon bar and click a shape to select it or drag to draw a marquee over the shapes you want to select.
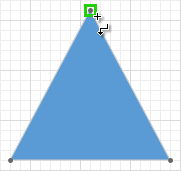
To resize a shape
Select the shape and drag a selection handle or change the Size property in the Properties Panel.
To move a shape
Select the shape and use the arrow keys on your keyboard or drag with the mouse. You can also change the Position property in the Properties panel.
To rotate a shape
Select the shape and drag the rotation handle with the mouse or change the Angle property in the Properties panel.
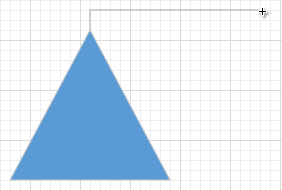
To add a connector
Select the Connector tool in the Tools group of the ribbon bar and drag on the canvas.
To initiate text editing
Double-click a shape or right-click it and select the Edit text menu item. You can also change the Text property within the Properties panel. The text can be formatted from the ribbon bar.
To undo or redo an action
Click the corresponding button  at the top of the Ribbon or press the CTRL+Z / CTRL+Y key combination.
To change the current zoom
Hold the CTRL button and rotate the mouse wheel or use the zoom track bar in the status bar.
Shapes are basic elements of the Diagram. You can add shapes to the diagram canvas by dragging them from the Shapes Panel.
Selection
Click a shape to select it. To select multiple shapes, hold the CTRL or SHIFT key and click each shape you want to select. Alternatively, click on the canvas and drag to create a selection rectangle around the shapes you want to select. To select all shapes in the page, press CTRL+A key combination. The selected shapes are outlined by a rectangle with selection handles. To deselect a shape, hold the CTRL or SHIFT key and click it. To deselect all shapes, press the ESC key.
Moving
To move the selected shape/shapes, drag it using the mouse or press arrow keys.
Resizing
To resize the selected shape or multiple shapes, drag one of the selection handles.
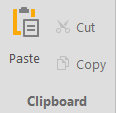
Copying
To copy the selected shape or multiple shapes, drag it while holding the CTRL key or press the CTRL+C key combination to copy the selection to clipboard and then press the CTRL+V key combination to paste the clipboard content to the canvas.
Rotation
To rotate the selected shape or multiple shapes, drag the rotation handle.
Transformation
Certain shapes display yellow handles when selected. These shapes can be transformed by dragging these handles.
Editing text
Double-click a shape to enter the text editing mode. To accept changes, press the ESC key or click anywhere on the canvas.
Expanding/collapsing subordinate items
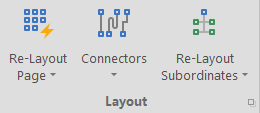
Click the expand-collapse button below a shape to show or hide the subordinate items.
Connectors are lines that connect shapes. When any of two connected shapes is being moved, the connector moves with the shape.
There are two connection types; Point connection and Dynamic connection
Point connection - a connector is glued to a specific connection point on a shape.
1. Select the Connector tool or press the CTRL+3 key combination.
2. Hover over a shape’s connection point so it becomes selected.
3. Click and drag to create a connector.
Dynamic connection - a connector is glued to a connection point that is nearest to the connector’s point of origin.
1. Select the Connector tool or press the CTRL+3 key combination.
2. Hover over a shape so it becomes selected.
3. Click and drag to create a connector.
A connector can have either connection type on either of its ends.
1. Click New to create a new canvas.
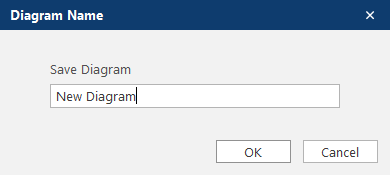
3. Click Save and enter the diagram's name then click OK.
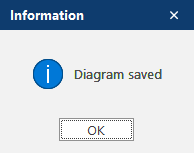
4. Click OK to close pop-up message.
1. Select the diagram from the Open drop-down menu.
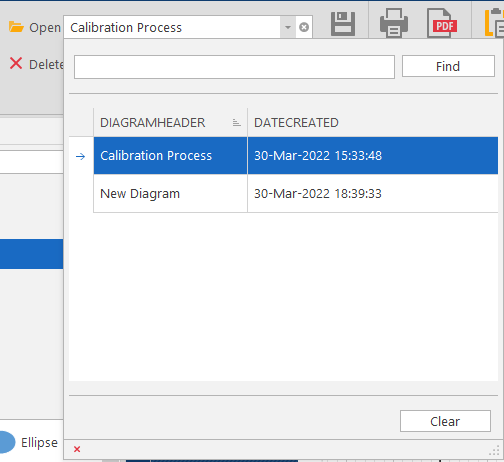
2. The selected diagram will open and load onto the canvas.
1. Click the clear button  to clear the diagram.
1. Select the diagram from the Open drop-down menu.
2. Once the diagram has loaded, click on Delete.
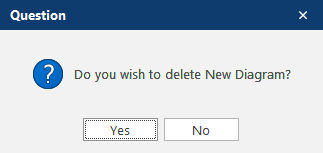
3. Click Yes to delete or No to discard.
1. Click Import and select an XML diagram file to import, then click Open.
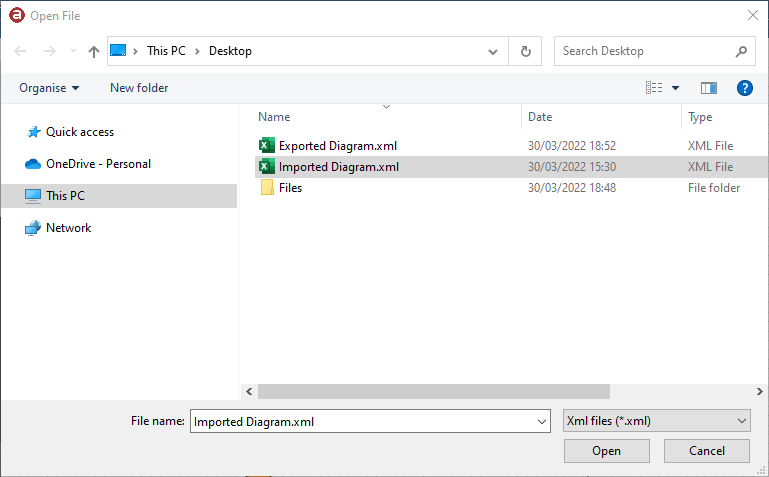
2. The imported diagram will open and load onto the canvas.
1. Click Export and enter a file name, then click Save.
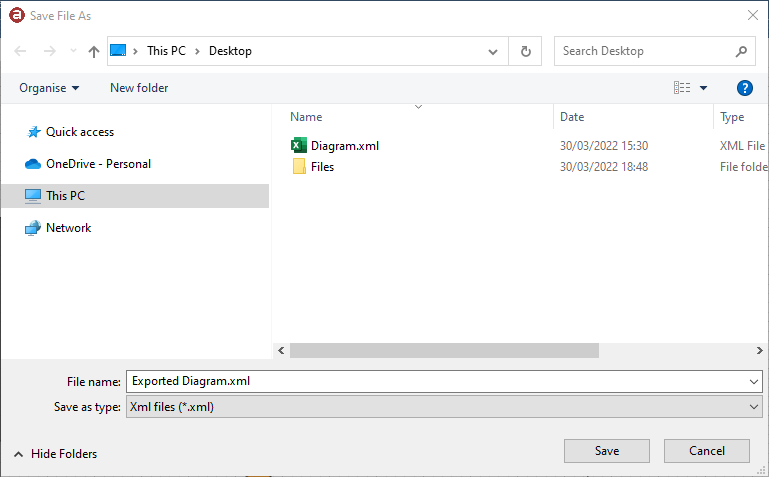
2. The exported diagram will save to your selected Save As location.